VOGAZ - Technical Analysis Tool and Charting Software
VOGAZ- A Technical Analysis Tool and Charting Software for Stock, Forex & Commodity Market Investors and Traders.
Wednesday, July 27, 2011
Tuesday, July 26, 2011
Dashboard - Vogaz.com
Technical Analysis Software India - – www.Vogaz.com
Dashboard is indicator based study, that gives bull and bear indicators for a given time interval. With dashboard traders can know how indicators are behaving for each time interval 1min, 5min, 10min,60 min etc. for a given stock, forex, commodity, future or option. Dashboard also summarizes the total number of bullish indicators against total number of bearish indicators.
This study is extremely useful at judging the market trend. It also enables trader to make safer and more confident decisions. It helps in avoiding mix trend, which is a very high risk time to invest.
Dashboard Forecaster
With Dashboard Forecaster you can check how technical indicators would react for a selected stock commodity forex future or option for a given price. In this the user can feed in the price that he wants the predictions on. On this user fed price, dashboard forecaster shows how technical indicators are behaving. Indicators indication can be checked on different time intervals from 1 to 60 minutes.
This study helps the users to know what the future trend can be like if a stock, commodity or future goes up or comes down in price. This can help the user make more accurate judgment.
Forecaster - Vogaz.com
Technical Analysis Software India - – www.Vogaz.com
Forecaster is the study based on strict parameters, formulas and calculations, which indicate the right price to enter or exit a trade. Forecaster gives a targeted reversal level and, loft and trash target from the last closed price. Forecaster gives price reversal level for a bullish and bearish trend, and it also summarizes if in the current trend there are long buildups or short buildups.
Let us take an example to explain how the forecaster works and helps to make better trading decision. Suppose a stock or commodity closed price/ current price is 100, it can either go up to 110 or come down to 90. So the investor is going to buy at 90 after it comes down or sell at 110 when it goes up.
In this case forecaster would indicate the bullish reversal price (Selling) as 110 and bearish reversal price (buying) as 90 when its current price is 100. These prices are indicated before the event happens or before the fall or rise of prices. This way the trader gets to know the entry and exit points. He would know if shorts are building up or it’s long trend, and decide accordingly.
Forecaster also gives trash and loft targets. Loft targets are the difference between the reversal levels of long market trend and the last closed price or current price of the stock, commodity or future. And trash targets are the difference between the reversal levels of short market trend and the current or last closed price. By loft and trash target you can also determine if the long or short buildup is getting weaker or stronger or is it even. In case it’s even, then it’s a high risk trade.
Let us take the same example as earlier to explain the loft and trash targets of forecaster, to get more insight on the topic. Now suppose the stock or commodity is at 100 and the long reversal is 110 and trash target is 10, and the short reversal level is 90 making the trash target to be 10. After awhile the stock or commodity rallies up to 105, making the loft target come down to 5 as the reversal level is still 110. And the trash target 15 for reversal level of short trend is still the same, 90.
In this case if the forecaster does not give a new reversal target, it would mean that the long trend is getting weaker. The trash target is still 5 and the reversal is near. If the forecaster gives fresh target and indicates a higher reversal level, it would indicate the long is still strong and the stock or commodity is likely to go higher.
The weaker the loft and trash target gets the more volatile it becomes, and is more susceptible to change.
Estimator - Vogaz.com
Technical Analysis Software India - – www.Vogaz.com
What is Estimator?
Estimator based on technical indicators gives a summarized result of the current market scenario. It gives a list of indicators with bull and bear signals against the, indicating how technical indicators are reacting in the current market, are they indicating a bull or a bear trend.
How does it work?
Estimator summarizes the total bull and bear signals for the current market scenario. It has green (bull) and red (bear) bars that indicate which out of the two trends dominating. If green bars are more it is a bullish trend and if red are more it is a bearish trend. Estimator’s result varies with different time intervals. For a small change in trend use 5 to 15 minutes time interval and for intermediate to major change in trend 60 to daily would be more relevant.
How does it benefit trader?
A trader would get to know when exactly to enter or exit a trade. Estimator would indicate whether in the current market scenario the stock, future or commodity is bullish bearish or is it a mixed trend. It prevents financial market investors from investing at the time of mixed trend, which is a high risk trade. It also shows how indicator is behaving, without having to use it on a chart and analyzing. Sometimes analyst wrongly interprets indicator and can get misguided. Predictor - Vogaz.com
Technical Analysis Software India - – www.Vogaz.com
What is Predictor?
It is a study, which uses technical indicators to predict future movement of stock, commodity or forex. It indicates or predetermines how equities and derivatives are going to behave for a given set of conditions (plus and minus prices, time intervals, technical indicators, etc.).
How does it work?
Predictor uses the last close price/current indicated price and, negative (minus) and positive (plus) predicted prices, to indicate how the movement of the share, commodity or forex can be in near future. It uses technical indicators like exponential moving averages, stochastic, etc. to indicate if the stock, commodity, future or option is bullish or bearish for the future predicted prices/ levels. It also gives best bullish and bearish levels. These are the levels at which maximum number of indicators indicate that the share, future, option, commodity or forex is bearish or is bullish or going to be bullish or bearish from.
How does it benefit trader?
It gives clear indication of bullish and bearish trends, current as well as future movement. Traders can select percentage difference from the current close price ranging from 0.05% – 3% that they want their predictions on, and study how technical indicators are reacting to those prices. Predictor makes it easier to get a confirm and safer trade, as it indicates both positive and negative movements. Traders get a clear picture that from what level the indicators are indicating a bear or a bull trend, leading him to act accordingly.
Saturday, May 7, 2011
Vogaz Technical Analysis Software.
Introducing Vogaz scanner with amazingly accurate technical signals and market indicators. You can scan EOD DLY and real time data of Stock, Forex & Commodity. VOGAZ scanner can scan Technical Analysis of Equities and Derivatives (Futures and Options) of National Stock Exchange of India (NSE), Bombay Stock Exchange (BSE), Multi Commodity Exchange of India (MCX), National Commodity & Derivative Exchange (NCDEX), National Multi Commodity Exchange of India (NMCE), MCX Stock Exchange (MCX-SX).
Now trade in Equity/Shares/Stocks with help of VOGAZ Technical Analysis and charting software. You can check Technical Analysis of your favorites Equity/Shares/Stocks, Analysis how Equity/Shares/Stocks are doing on charts, are they bullish or bearish in the financial markets
Trade Future and Options with higher success rate with Vogaz technical analysis software.
Now trade in Commodities with the help of VOGAZ Technical Analysis and charting software. You can check Technical Analysis of your favorites Commodities, Analysis how Commodities are doing on charts and are they bullish or bearish in the financial markets.
Now trade in Mutual Funds with VOGAZ Mutual Fund Tracker. You can check Technical Analysis of your favorite Mutual Funds you can Analysis how Mutual Funds are doing on charts and are they bullish or bearish in the financial markets. Mutual Funds price movements can be checked/watched in different price styles and with different Technical Indicators.
Vogaz Heat Map - Stock Forex and Commodity market heat map is basically a big grid that breaks down individual stocks Forex and commodity. Each stock is given its own rectangle or square. The colour is usually relevant to the equities price, and the colour is a shade ranging from dark red to light green. Heat map gives you the idea of stock forex and commodity with this colour range.
Foreign Institutional Investors / Domestic Institutional Investors (FII/ DII) - You can check Technical Analysis of your favorite Foreign Institutional Investor (FII)/ Domestic Institutional Investors (DII) you can Analyze what FII/DII are doing on charts and are they bullish or bearish in the financial markets only big financial players can change the movements of financial markets so you have to know what they thinking. Watch how much FII and DII are pumped or Pulled out of the financial markets. A close watch on these investments is essential for making buying and selling decisions.
What is Technical Analysis?
What is Technical Analysis?
Technical Analysis is the forecasting of future price movements of share/stock forex or commodity based on an examination of past price movements. Technical analysis does not lead to absolute predictions about the future. In lieu, technical analysis can help investors anticipate what is "likely" to happen to prices over time. In this the analyst uses a wide variety of charts and data to predict the future of the share forex commodity and even mutual funds. It enables them to define buying and selling patterns in every possible way, and get better chances at succeeding in financial market. One of its advantages is that it makes it easier to follow up with a number of stocks with technical analysis.
Technical analysts use technical Analysis Software to perform technical analysis or charting as it is also often called. These charting tools are helpful in providing information.
VOGAZ is the best Technical Analysis & Predicting, Forecasting, Estimating, Graphing & Charting Software for Stock, Forex & Commodity Market Investors and Traders of NSE, BSE, MCX, MCX-SX, NCDEX, NMCE Exchanges India.
Wednesday, May 4, 2011
Directional Movement System
Technical Analysis Software : Directional Movement System
Directional Movement System contains five indicators; ADX, DI+, DI-, DX, and ADXR. The ADX (Average Directional Movement Index) is an indicator of how much the market is trending, either up or down- the higher the ADX line, the more the market is trending and the more suitable it becomes for a trend-following system. This indicator consists of two lines- DI+ and DI-, the first one being a measure of uptrend and the second one a measure of downtrend. The standard Directional Movement System draws a 14 period DI+ and a 14 period DI- in the same chart panel. ADX is also sometimes shown in the same chart panel. A buy signal is given when DI+ crosses over DI-, a sell signal is given when DI- crosses over DI+. The Directional Movement System helps determine if an instrument is trending.The system involves 5 indicators which are the Directional Movement Index (DX), the plus Directional Indicator (+DI), the minus Directional Indicator (-DI), the average Directional Movement (ADX) and the Directional movement rating (ADXR).
For intra-day analysis, he compared current period with the previous period. the trading range for current period extended primarily above previous period then directional movement was considered to be up. If it extended primarily below previous period's range then directional movement was considered to be down. There are also rules for handling inside, outside and limit periods. stating that the directional movement is the largest part of current period's range that lies outside previous period's range.
The key feature of the Directional Movement System is that it first identifies whether the market is trending before providing signals for trading the trend. It measures the ability of bulls and bears to move price outside the previous period's trading range
+DI measure positive, or upside, movement, -DI measures downward, or negative, movement.. The basic Directional Movement Trading system involves plotting the 14period +DI and the 14 period -DI on top of each other. When the +DI rises above the -DI, it is a bullish signal. A bearish signal occurs when the +DI falls below the -DI.
Detrended Price Oscillator
Technical Analysis Software : Detrended Price Oscillator
The Detrended Price Oscillator is used when long-term trends or outliers must be removed from prices or index indicators. This indicator is often used to supplement a standard price chart. Other indicators can be plotted over the Detrended Price Oscillator. The Detrended Price Oscillator ("DPO") attempts to eliminate the trend in prices & smoothes the trend in prices. It compares closing price to a prior moving average, eliminating cycles longer than the moving average. It is used to isolate short-term cycles. Short-term cycles add together like musical harmonics to create longer-term cycles. By studying the shorter-term harmonics of a long-term cycle, turning points in the major cycle can be determined. The DPO removes the longer-term cycles from prices, making the shorter-term cycles more visible. The Detrended Price Oscillator is most effective with indicator periods of 21 or less.
Detrended prices allow to more easily identifying cycles and overbought/oversold levels. Short- term cycles add together to create longer-term cycles. Analyzing these shorter-term components of the long-term cycles can be helpful in identifying major turning points in the longer-term cycle. The DPO helps to remove these longer-term cycles from prices.Comparative Relative Strength
Technical Analysis Software : Comparative Relative Strength
The Comparative Relative Strength index divides one price field by another price field. The base security is outperforming the other security when the Comparative RSI is trending upwards. Comparative Relative Strength compares two securities to show how the securities are performing relative to each other.
The Comparative Relative Strength index divides one price field by another price field. The base security is outperforming the other security when the Comparative RSI is trending upwards. Comparative Relative Strength compares two securities to show how the securities are performing relative to each other.
Comparative Relative Strength compares a security's price change with that of a "base" security. When the Comparative Relative Strength indicator is moving up, it shows that the security is performing better than the base security. When the indicator is moving sideways, it shows that both securities are performing the same (i.e., rising and falling by the same percentages). When the indicator is moving down, it shows that the security is performing worse than the base security.
Comparative Relative Strength is often used to compare a security's performance with a market index. It is also useful in developing spreads .
Commodity Channel Index
Technical Analysis Software : Commodity Channel Index
The purpose of CCI indicator is to identify cyclical turns in commodities. This indicator oscillates between an overbought and oversold condition and works best in a sideways market. The assumption behind the indicator is that commodities (or stocks or bonds) move in cycles, with highs and lows coming at periodic intervals.
The Commodity Channel Index (CCI) is a timing tool that works best with seasonal or cyclical contracts. It keeps trades neutral in a sideways moving market, and helps get in the market when a breakout occurs.
The CCI is a versatile indicator capable of producing a wide array of buy and sell signals. CCI can be used to identify overbought and oversold levels. A security would be deemed oversold when the CCI dips below -100 and overbought when it exceeds +100. From oversold levels, a buy signal might be given when the CCI moves back above -100. From overbought levels, a sell signal might be given when the CCI moved back below +100.
CCI also help identify price reversals, price extremes and trend strength. CCI fits into the momentum category of oscillators
Chande Momentum Oscillator
Technical Analysis Software : Chande Momentum Oscillator
The Chande Momentum Oscillator (Chande) is an advanced momentum oscillator derived from linear regression. Increasingly high values of CMO may indicate that prices are trending strongly upwards. Conversely, increasingly low values of CMO may indicate that prices are trending strongly downwards. CMO is related to MACD and Price Rate of Change (ROC). The Chande's Momentum Oscillator function determines the momentum of price data by comparing the size of recent negative price changes to the size of recent positive price changes.
This function determines the momentum of price data by comparing the size of negative price changes to the size of positive price changes. The value resultant value is normalized from -100 to 100 where negative values indicate larger negative cumulative price changes and positive values indicate larger positive cumulative price changes.There are two different ways that this oscillator is used as a trading signal.
The Chande Momentum Oscillator (Chande) is an advanced momentum oscillator derived from linear regression. Increasingly high values of CMO may indicate that prices are trending strongly upwards. Conversely, increasingly low values of CMO may indicate that prices are trending strongly downwards. CMO is related to MACD and Price Rate of Change (ROC). The Chande's Momentum Oscillator function determines the momentum of price data by comparing the size of recent negative price changes to the size of recent positive price changes.
This function determines the momentum of price data by comparing the size of negative price changes to the size of positive price changes. The value resultant value is normalized from -100 to 100 where negative values indicate larger negative cumulative price changes and positive values indicate larger positive cumulative price changes.
There are two different ways that this oscillator is used as a trading signal. The first is to measure overbought (greater than 50%) or oversold (less than -50%) levels for a given instrument. The second method is to buy when the oscillator crosses above its moving average line and to sell when the oscillator crosses below its moving average line.
Momentum indicators are useful for determining trends in data. This indicator can be used as an overbought/oversold Indicator. As a general rule, a instrument is considered to be overbought if this indicator is greater than 50 and oversold if this indicator is less than 50. It can also be used to determine the degree to which an instrument is trending.Chaikin Volatility
Technical Analysis Software : Chaikin Volatility
The Chaikin Volatility Oscillator is a moving average derivative of the Accumulation/Distribution index. The Chaikin Volatility Oscillator adjusts with respect to volatility, independent of long-term price action. The Chaikin Volatility Indicator represents the difference between periodic high and low prices. Increases in the indicator reflect increased volatility in the price, which potentially signals the end of a price trend. The indicator will peak when the price reaches a new high or a new low.
The Chaikin Volatility Indicator is constructed as the difference between a moving average of high-low price range for current period versus the high-low moving average n periods ago. The indicator requires two input fields- the moving average period (first input) and the period over which the moving average difference will be calculated (second input).
It measures volatility as the trading range between high and low for each period. There are two ways to interpret this measure of volatility.
One method assumes that market tops are generally accompanied by increased volatility and that the latter stages of a market bottom are generally accompanied by decreased volatility.
Another method assumes that an increase in the Volatility indicator over a relatively short time period indicates that a bottom is near and that a decrease in volatility over a longer time period indicates an approaching top .
Vogaz : The Technical Analysis & Charting Computer Application
Vogaz the technical analysis and charting computer application for forex investors and traders of NSE, BSE, MCX, MCX-SX, NCDEX, and NMCE, with its avant-garde charting, best user affable interface and absurd appearance like diviner and augur not alone makes trading smarter, safer and easier but gives it a accomplished fresh edge. Vogaz with the help of its features help financial market investors and traders to accomplish smarter and safer decisions. Vogaz gives you the ultimate abandon with
Vogaz Augur Diviner & Estimator
Today’s activating banking markets charge adjustable accommodation authoritative with fast, accessible after light capabilities. Vogaz predictor, will advice you accomplish quicker and safer decisions. Augur is advised to automatically acquaint you the approaching of the stock, forex or commodity. With Vogaz Augur you would apperceive the appropriate amount to shop for or advertise the share, forex or commodity. Augur with the advice of awful activated studies and ambit will accord you abundant success in share/stock, forex and article market. This automatically analyses equities and derivatives (future & options) of NSE, BSE, MCX, NCDEX, NMCE and MCX-SX. Augur increases the all-embracing capability of trading and investing. With the advice of Vogaz you can consistently accomplish appropriate trading decisions and win in today’s market.
Vogaz additionally gives you the privileges of the Forecaster, with appropriate balderdash and buck indicators. With Diviner you would get to apperceive if account and circadian movements of share/ stock, forex & article were bullish or bearish. The abstruse indicators in diviner will advice you accomplish close decisions for best after-effects in the financial market.
Vogaz analysis says that best numbers of intraday traders eventually lose their money sooner or later. The rarest of attenuate intraday traders who administer to cull out profits go through abundant risks which are alarming for any business. Vogaz Delay analyses the bazaar and delivers the best for Trading with the best trading strategies and gives the best accessible result. Trading with Vogaz Delay would save you from speculation, artificially created buying, banker traps, broker traps, affected affairs & selling, affected account created by fresh channels, allowance affairs and baby/amateur operator. In an overview Vogaz can advice you abstain such accidents and advice you accomplish your targets added cautiously and smartly.
Please appointment our website for added detail of our articles and features. For added capacity you can additionally write, e-mail or alarm us at www.vogaz.com.
VOGAZ : The Technical Analysis Software
VOGAZ : The Technical Analysis Software
VOGAZ the technical analysis & charting software for stock forex commodity market investors and traders of NSE, BSE, MCX, MCX-SX, NCDEX, and NMCE, with its highly advanced charting, most user friendly interface and incredible features like forecaster and predictor not only makes trading smarter , safer and easier but gives it a whole new edge. VOGAZ with its technical analysis helps market investors and traders to make smarter and safer decisions.
VOGAZ Predictor Forecaster & Estimator
Today’s dynamic financial markets need flexible decision making with fast, easy revision capabilities. With Vogaz predictor, will help you make quicker and safer decisions. Predictor is designed to automatically tell you the future of the stock, forex or commodity. With VOGAZ Predictor you would know the right price to buy or sell the share, forex or commodity. Predictor with the help of highly tested studies and parameters will give you great success in share/stock market, forex and commodity market. This automatically analyses equities and derivatives (future & options) of NSE, BSE, MCX, NCDEX, NMCE and MCX-SX. Predictor increases the overall effectiveness of trading and investing. With the help of Vogaz you can consistently make right trading decisions and win in today’s market.
VOGAZ also gives you the privileges of the Forecaster, with special bull and bear indicators. With Forecaster you would get to know if monthly weekly and daily movements of share/ stock, forex & commodity were bullish or bearish. The technical indicators in forecaster will help you make firm decisions for best results in the financial market.
VOGAZ research says that maximum numbers of intraday traders lose their money sooner or later. The rarest of rare intraday traders who manage to pull out profits go through heavy risks which are dangerous for any business. VOGAZ Delay analyses the market and delivers the best for trading with the best trading strategies and gives the best possible result. Trading with VOGAZ Delay would save you from speculation, artificially created buying, trader traps, fake buying & selling, fake news created by new channels, margin selling and small operator. In an overview VOGAZ can help you avoid such accidents and help you achieve your targets more safely and smartly.
Please visit our website for further detail of our products and features. For more details you can also write, e-mail or call us at the details at www.vogaz.com
Monday, April 18, 2011
Vogaz - Chaikin Money Flow
The Chaikin Money Flow oscillator is a momentum indicator that spots buying and selling by calculating price and volume together. This indicator is based upon Chaikin Accumulation/Distribution, which is in turn based upon the premise that if a stock closes above its midpoint [(high+low)/2] for the day then there was accumulation that day, and if it closes below its midpoint, then there was distribution that day.
Chaikin Money Flow oscillator is calculated from the periodic readings of the Accumulation/Distribution Line.
Chaikin Money Flow is based on the observation that buying support is normally signaled by increased volume and frequent closes in the top half of the period's range. Likewise, selling pressure is evidenced by increased volume and frequent closes in the lower half of the periodic range.
A positive Chaikin Money Flow signals accumulation, while distribution is signaled by the indicator line below zero. The higher the reading (above or below zero), the stronger the signal.
The indicator often warns of break-outs & provides useful trend confirmation. When price is trading in a range, volume may indicate in which direction a breakout is most likely to occur. Higher volume at peaks means that an upward breakout is more likely. Higher volume at troughs indicates that a downward breakout is more likely.
There are three items that determine if an instrument is under accumulation and the strength of the accumulation.
1. If Chaikin Money Flow greater than zero, it is an indication of buying pressure and accumulation when the indicator is positive
2. The second item- determine how long the oscillator has been able to remain above zero. The longer the oscillator remains above zero, the more evidence there is that the security is under sustained accumulation. Extended periods of accumulation or buying pressure are bullish and indicate that sentiment towards the security remains positive.
The third indication- the actual level of the oscillator. Not only should the oscillator remain above zero, but it should also be able to increase and attain a certain level. The more positive the reading is, the more evidence of buying pressure and accumulation.
Vogaz - Bollinger Bands
Bollinger Bands are similar in comparison to moving average envelopes. Bollinger Bands are calculated using standard deviations instead of shifting bands by a fixed percentage. Bollinger Bands (as with most bands) can be imposed over an actual price or another indicator. When prices rise above the upper band or fall below the lower band, a change in direction may occur when the price penetrates the band after a small reversal from the opposite direction. Bollinger Bands are lines plotted in and around the price structure to form an "envelope." It is the action of prices near the edges of the envelope. Bollinger Bands are based upon a simple moving average.
Bollinger recommends using a 20-period simple moving average for the center band and 2 standard deviations for the outer bands. The length of the moving average and number of deviations can be adjusted to better suit individual preferences and specific characteristics of an instrument.
Bollinger Bands is a indicator that allow comparing volatility and relative price levels over a period. It can be combined with price action to generate signals and foreshadow significant moves.
It serves many functions-
• To identify periods of high and low volatility
• To identify periods when prices are at extreme, and possibly unsustainable, levels.
• To arrive at rigorous buy and sell decisions.
Vogaz - Aroon Oscillator
A separate indicator called the Aroon Oscillator can be constructed by subtracting Aroon (down) from Aroon (up). Aroon Oscillator oscillates between -100 and +100 with zero as the center crossover line.
The Aroon Oscillator, the positive value indicates an upward trend (or coming trend), and the negative value indicates a downward trend. The higher the absolute value of an oscillator, the stronger is an indication of a trend.
It is used to determine whether the instrument is trending and how stable the trend is. It signals an upward trend is underway when it is above zero and a downward trend is underway when it falls below zero. The farther away the oscillator is from the zero line, the stronger the trend.
Vogaz - Aroon
The Aroon indicator is often used to determine whether a stock is trending or not and how stable the trend is. Trends are determined by extreme values (above 80) of both lines (Aroon up and Aroon down), whereas unstable prices are determined when both lines are low (less than 20). It is a trend indicator - used to determine if the security is moving in a trend or sideways, as well as how strong the trend is. If the price of a security is rising, the Close for the period will be closer to the end of the period, and vice versa. The Aroon indicator shows how much time passed between the highest (up) or lowest (down) Close since the beginning of a period (in percents).
Aroon indicator consists of two lines - Aroon(up) and Aroon(down). AroonUp for a given time period is calculated by determining how much time (on a percentage basis) elapsed between the start of the time period and the point at which the highest closing price during that time period occurred. AroonUp will be 100 when the instrument is setting new highs for the period. Conversely, AroonUp will be 0 if the instrument has continually dropped throughout the period. AroonDown is calculated in a similar manner, expect looking for lows as opposed to highs.
Aroon is used to measure the presence and strength of trends. When Aroon(up) and Aroon(down) are moving together, there is no clear trend (the price is moving sideways, or about to move sideways). Aroon indicator consists of two lines - Aroon(up) and Aroon(down). AroonUp for a given time period is calculated by determining how much time (on a percentage basis) elapsed between the start of the time period and the point at which the highest closing price during that time period occurred. AroonUp will be 100 when the instrument is setting new highs for the period. Conversely, AroonUp will be 0 if the instrument has continually dropped throughout the period. AroonDown is calculated in a similar manner, expect looking for lows as opposed to highs.
When the Aroon(up) is below 50, it is an indication that the uptrend is losing its momentum, while when the Aroon(down) is below 50, it is an indication that the downtrend is losing its momentum.
When the Aroon(up) or Aroon(down) are above 70, it indicate a strong trend in the same direction, while when the value is below 30, it indicates a trend coming in an opposite direction.
Vogaz - Accumulative Swing Index
The Accumulation Swing Index (Wilder) is a cumulative total of the Swing Index. The Accumulation Swing Index may be analyzed using technical indicators, line studies, and chart patterns, as an alternative view of price action. The accumulation swing index (ASI) is a variation of Welles Wilder's swing index. It plots a running total of the swing index value of each bar. The swing index is a value from 0 to 100 for an up bar and 0 to -100 for a down bar. The swing index is calculated by using the current bar's open, high, low and close, as well as the previous bar's open and close. The swing index is a popular tool in the futures market.
The Accumulative Swing Index is a cumulative total of the Swing Index. The Accumulative Swing Index provides a numerical value that quantifies price swings.
It defines short-term swing points. It indicates the real strength and direction of the market. The accumulative swing index is used to gain a better long-term .If the long-term trend is up, the accumulative swing index is a positive value. Conversely, if the long-term trend is down, the accumulative swing index is a negative value. If the long-term trend is sideways (non-trending), the accumulative swing index fluctuates between positive and negative values. This indicator is used to analyze futures but can be applied to stocks as well.ASI will give the technician numerical price swings that are value quantified, and it will show short-term trend turnarounds. A breakout is indicated when the accumulative swing index exceeds its value in the period when a previous significant high swing point was made. A downside breakout is indicated when the value of the Accumulative swing index drops below its value in a period when a previous significant low swing point was made.
Sunday, April 17, 2011
Darvas boxes
Darvas boxes
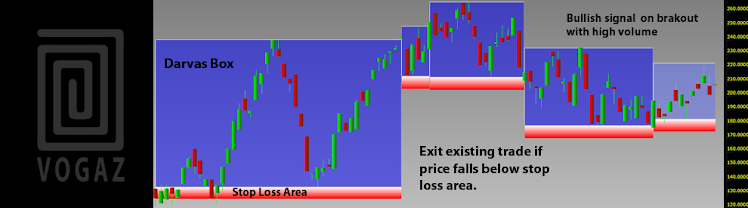
Darvas boxes are dynamic trading range boxes that are based upon a state machine algorithm.These boxes have two areas. The bottom part is a stop loss area and the top part is the break out area.
When prices break above the top of the box, it's a buy signal if the instrument was making new 12-month highs on high volume, allowing to stay long and add new positions as new boxes developed. When the price of the stock dipped below the stop loss section of the box (a percentage of the price, just below the bottom of the box), take profits and move on to something else.
One would buy the security when prices broke out of the top of the box on high volume, typically only if the security was making a new 12-month high. If an existing position was held, one would exit the security if the price fell below the stop loss area (the bottom of the box).
Darvas boxes are drawn when certain conditions were met-
· The price had reached a new high
· A volume breakout is required for the first box in a series
· The high was followed by 3 consecutive periods that did not trade higher. This formed the top of the box and the first day of the box.
· On or after the high, a low is found that is followed by 3 consecutive periods that did not trade lower. This forms the bottom of the box.
Once a box was constructed, Market entry is made when the price push through the top of the box. Position is held while the price is above the stop level. When subsequent boxes are made, the stop level is set to just below the bottom of the next box. The Darvas box uses several steps to identify a top and bottom, or acceptable trading range. The boxes are used to normalize a trend. A "buy" signal would be indicated when the price of the stock exceeds the top of the box. A "sell" signal would be indicated when the price of the stock falls below the bottom of the box. Darvas' original interpretation was to only buy when there was a pattern of boxes stacking on top of each other and to place the stop loss at the top of the previous box
Heikin Ashi
A type of candlestick chart that shares many characteristics with standard candlestick charts, but differs because of the values used to create each bar. Instead of using the open-high-low-close (OHLC) bars like standard candlestick charts, the Heikin-Ashi technique uses a modified formula-
Close = (Open+High+Low+Close)/4
Open = [Open (previous bar) + Close (previous bar)]/2
High = Max (High,Open,Close)
Low = Min (Low,Open, Close)
Close = (Open+High+Low+Close)/4
Open = [Open (previous bar) + Close (previous bar)]/2
High = Max (High,Open,Close)
Low = Min (Low,Open, Close)
These charts can be applied to many markets; however, they are most often used in the equity and commodity markets.
There are five primary signals that identify trends and buying opportunities-
- Hollow candles with no lower "shadows" indicate a strong uptrend- Hollow candles signify an uptrend- you might want to add to your long position, and exit short positions.
- One candle with a small body surrounded by upper and lower shadows indicates a trend change- risk-loving traders might buy or sell here, while others will wait for confirmation before going short or long.
- Filled candles indicate a downtrend- you might want to add to your short position, and exit long positions.
- Filled candles with no higher shadows identify a strong downtrend- stay short until there's a change in trend.
These signals show that locating trends or opportunities becomes a lot easier with this system. The trends are not interrupted by false signals as often, and are thus more easily spotted. Furthermore, opportunities to buy during times of consolidation are also apparent.
The Heikin-Ashi technique is used by technical traders to identify a given trend more easily. Hollow candles with no lower shadows are used to signal a strong uptrend, while filled candles with no higher shadow are used to identify a strong downtrend.
This technique should be used in combination with standard candlestick charts or other indicators to provide a technical trader the information needed to make a profitable trade.
Conclusion
The Heikin-Ashi technique is extremely useful for making candlestick charts more readable--trends can be located more easily, and buying opportunities can be spotted at a glance. The charts are constructed in the same manner as a normal candlestick chart, with the exception of the modified bar formulas. When properly used, this technique can help you spot trends and trend changes from which you can profit!
Three Line Break
Three Line Break
Three Line Break charts display a series of vertical boxes that are based on changes in prices. It ignores the passage of time. The Three Line Break charting method is so-named because of the number of lines typically used.
The three line break chart is similar in concept to point and figure charts. The decision criteria for determining are somewhat different. The three-line break chart looks like a series of rising and falling lines of varying heights. Each new line, like the X's and O's of a point and figure chart, occupies a new column. Using closing prices (or highs and lows), a new rising line is drawn if the previous high is exceeded. A new falling line is drawn if the price hits a new low.
The term "three line break" comes from the criterion that the price has to break the high or low of the previous three lines in order to reverse and create a line of the opposite color. The Three Line Break Charts are actually Any Line Break Charts.
The following are the basic trading rules for a three-line break chart-
· Buy when a green line emerges after three adjacent black lines (a green turnaround line).
· Sell when a red line appears after three adjacent white lines (a red turnaround line).
· Avoid trading in trend less markets where the lines alternate between red and green
Line Break charts are always based on closing prices.
An advantage of Three Line Break charts is that there is no arbitrary fixed reversal amount. It is the price action, which gives the indication of a reversal. It is use to determine the prevailing trend.
The disadvantage of Three Line Break charts is that the signals are generated after the new trend is well under way. However, many traders are willing to accept the late signals in exchange for calling major trends.
You can adjust the sensitivity of the reversal criteria by changing the number of lines in the break
Three Line Break chart focus on price, eliminate much of market noise & identify trend more clearly. Combined with candle signals, they can be the basis of an effective trading strategy
Subscribe to:
Posts (Atom)